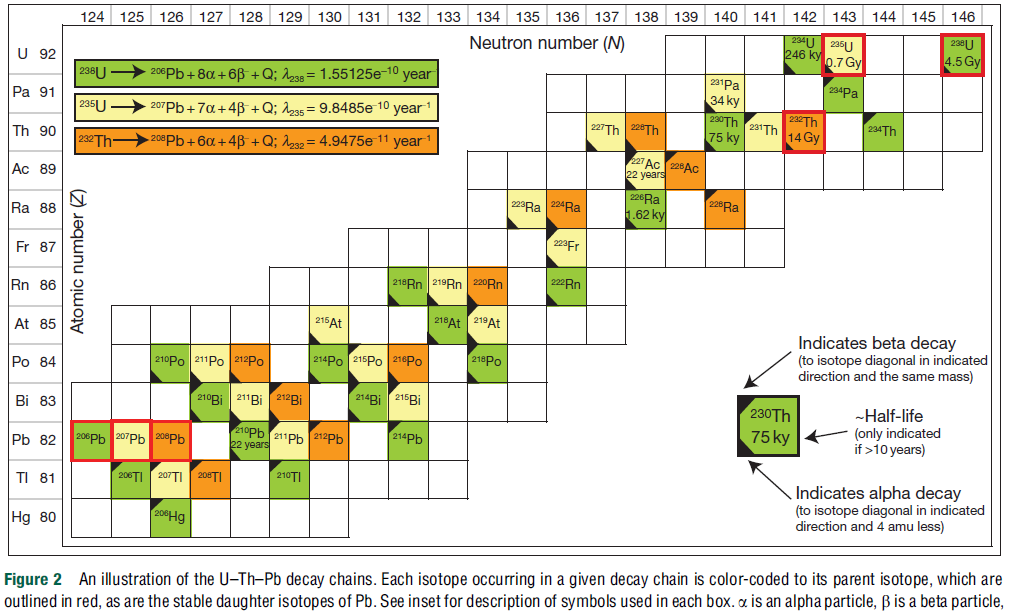
This figure is taken from Schoene (2014)
Uranium Lead dating is done by assuming radiogenic Pb originates from the in-situ decay of Uranium. Radiogenic Pb is sometimes present in the absence Uranium and natural systems are not in secular equilibrium. The formulas used to determine the age of a rock from the 207Pb/235U and 206Pb/238U ratios are only valid for systems that start off from secular equilibrium. These ratios are useful to compute an upper-bound for the age of the sample. An upper-bound for the age of coal is 350k years, 3 orders less than what is commonly thought that the carboniferous period occured 350 million years ago.
Uranium Lead dating is used to determine the age of rocks. The formula used is:
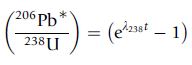
This formula is valid for systems that start off from secular equilibrium, i.e. for every 238U atom that decays, there is a 234U atom that decays, there is a 230Th atom that decays... , and there is a 206Pb atom produced.
Concentric tiny dark and light rings have been found in rocks. This discoloration is due to radiation from radioactive inclusions trapped inside a host rock.

This photo is taken from halos.com
Gentry (1973) wrote, Specifically ion probe analyses have shown one 210Po halo
inclusion that contained Pb without any detectable 204Pb, U, or
Th
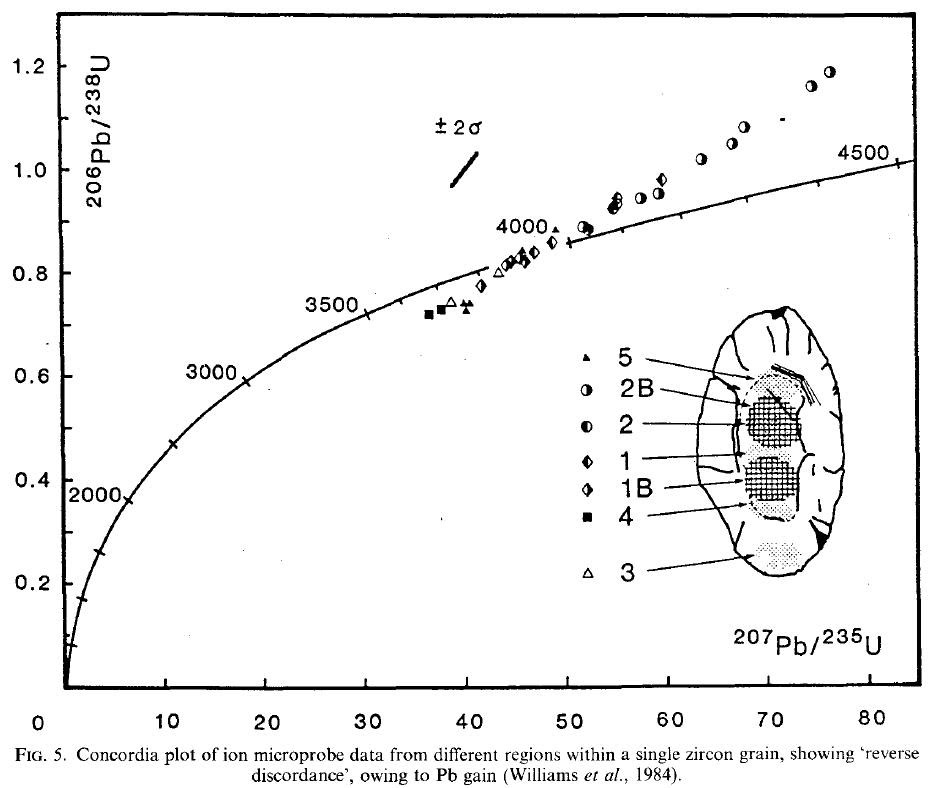
The following data is taken from a zircon crystal smaller than 1mm (Wilde et. al., 2001), and it can be seen that the 207Pb/235U and 206Pb/238U ratios widely vary at different locations within such a small crystal.
Surely different spots in a tiny crystal did not crystalize out at vastly different times, so it is meaningless to assign a different age to each spot.
The ratio of 206Pb/204Pb in magma varies from 16-19 (Jourdan et al., 2007; Turner et al., 2003). 204Pb is not formed from radioactive decay. If the ratio of 204Pb/206Pb in zircon is 0, or very much less than 0.02, we can conclude that the 206Pb found in zircon is not common Pb from magma, but radiogenic Pb produced within the crystal after it formed.
Yes, varying amounts of Pb have been produced from a given amount of U.238U decays to 206Pb via many
intermediate isotopes such as 234U, 230Th, 226Ra
and 214Po. 235U
too
decays to 207Pb via many intermediate isotopes such as
231Pa and 223Ra.
Goldstein et al. (1994) have measured the activity
ratio of 231Pa/235U to be 2.5 in magma. This
means that for
every 235U
atom that decays, there are 2.5 atoms of 231Pa that decay.
The
226Ra/230Th activity was measured to be varying
from 2.0 to 2.8. Schmitt (2007) measured U-Pa ratios and wrote, Zircon crystals from Salton Buttes rhyolite show evidence for excess 231Pa with a weighted average (231Pa)/(235U) activity ratio of 1.9
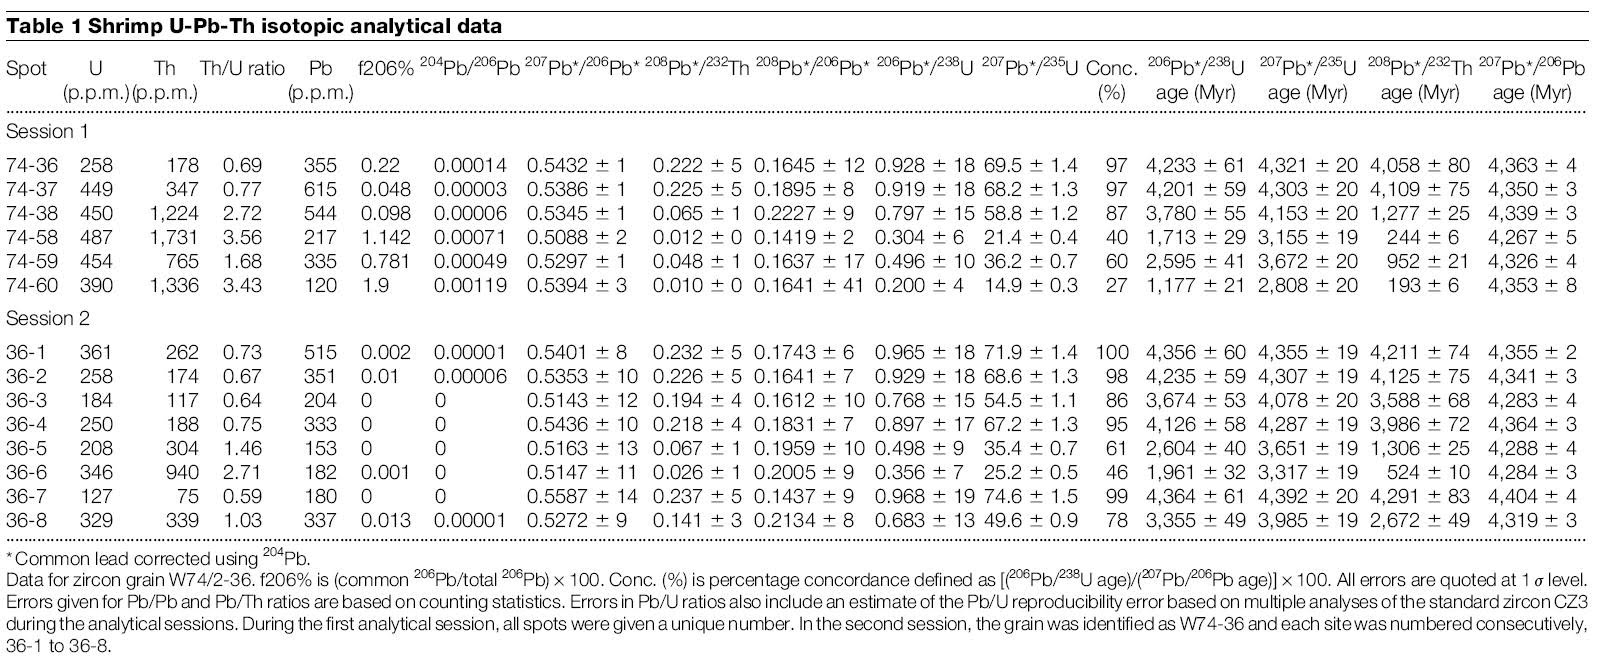
Different locations within a zircon contains different amount of impurities. In table 1 above, we can see that spot 36-7 contained Th impurity of 75ppm, while spot 36-6 contained 940ppm of Th.
The Pb closure temperature of zircon is 900oC (Cherniak et. al., 2001). This means that below 900oC, Pb can neither diffuse in nor out of zircon. It is reasonable to assume that after a zircon has formed, there are no natural means to heat the crystal above 900oC. To explain varying U-Pb ratios, one cannot use Pb diffusion.
The most common explanation that has been given in the literature is Pb diffusion. When the data falls below the concordia curve, the reason given is Pb loss, and when the data is above the curve, the reason given is Pb gain.
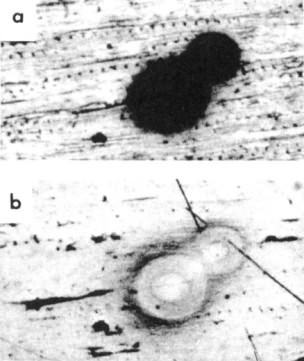
This figure is taken from Reed (1989)
Even if Pb diffusion happens in zircon, it is probably at the surface or along cracks. Geologists polish the crystal prior to doing measurements and they choose spots that do not have cracks. Wilde et. al. (2001) wrote, crack-free domains greater than 50mm in diameter were present and, after oxygen isotope and rare earth element (REE) analysis, approximately 20um ground off the surface of the zircon to remove all previous analytical pits
234U is often in equilibrium with 238U in magma sources (i.e. Sato et. al., 2001), so we can assume that Uranium bearing rocks started off with 234U/238U activity of 1. The half-life of the other isotopes in the decay chain of U are less than 100k years. One would expect that after a few million years, the difference of radiogenic Pb produced due to initial disequilibrium becomes negligible and the U/Pb ratios at all spots would be very concordant as a result of attaining secular equilibrium.
The varying U/Pb ratios suggest an age less than few million years.
The image below from Pal (2004) is a radiohalo from a chlorite at a Uranium deposit shows circular rings. These rings prove that the daughter isotopes did not move away from their parents.
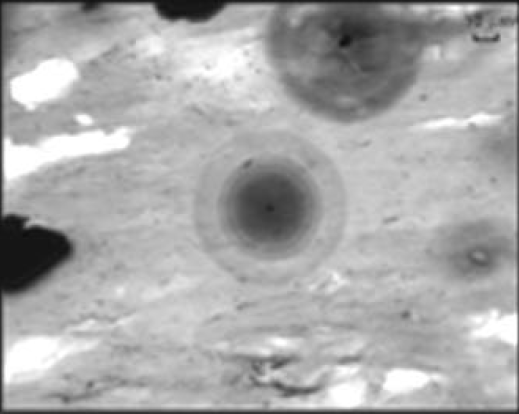
This figure is taken from Pal (2004)
In some cases where the radiohalo is elliptical, it's a sign of small mobility (movement of a few um since its inclusion). Pal (2004) wrote, In some cases, concentric halos line up along the foliation planes.
In cases where the halos line up along a conduit, then it means that the host rock formed first, and Uranium enriched waters flowed through the rock and precipitated or crystallized at certain spots. In cases where the halo is circular and not at a conduit, the host rock and the Uranium inclusion solidified at the same time.
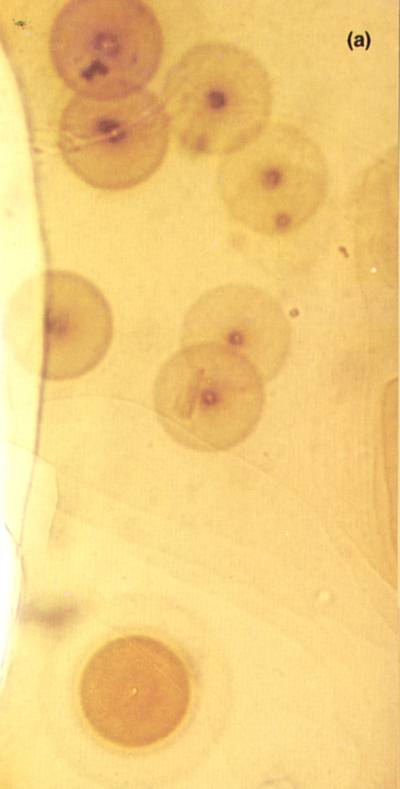
The ratio of U/Pb in Uranium enriched inclusions can be used to compute an upper-bound of the age. Gentry's (1976) measurements U radiocenters in coal revealed, 238U/206Pb ratios of approximately 2230, 2520, 8150, 8300, 8750, 18700, 19500, 21000, 21900 and 27300.
If we assume that when this Uranium inclusion formed, 234U was in equilibrium with 238U, and none of the other daughter isotopes were present, then a 238U/206Pb ratio of 27300 corresponds to 350000 years.
This figure is taken from Gentry (1976)
Gentry (1976) added, To obtain 238U/206Pb ratios that more accurately reflect the amount of Pb from in situ U decay, a search was made for sites with even higher ratios, for such areas possibly contained negligible amounts of extraneous Pb. Two halo radiocenters were found that exhibited 238U+ signals of 4 × 10⁴ and 6.4 × 10⁴ cps, respectively while the 206Pb+ signals were indistinguishable from background (<3 cps) in both cases (207Pb also absent).
If the elliptical halos in coal are along the capillaries of wood, then maybe before the tree was buried, groundwaters enriched in Uranium were flowing up the tree by capillary action. When the liquid stops flowing after the tree is buried and some Uranium starts accumulating at some point along the conduit, it will attract other Uranium atoms to itself.
Science, in a sense is similar to faith. There are many unknowns. Jesus (30) taught us to make conclusions based on what we can see, saying Look at the birds of the air; they do not sow or reap or store away in barns, and yet your heavenly father feeds them. Are you not much more valuable than they?
Some creationists argue that radiometric decay has not been a constant. If we observe it to be constant today, we can conclude it has been that way ever since. If we observe that zircon is resistant to diffusion, there's no need to imagine an unrealistic scenario some time in the past that allowed Pb to diffuse through.
© Selva Harris
2016