SN1987a was the superposition of 3 supernovae. The evidence for the 3 SNe is based on the fact that there were 3 bright sources, 3 peaks in its light curve, 3 light echoes and 3 rings of ejecta.
SN1987a was first seen on Feb 23, 1987. This has been the brightest supernova observed in recent times.
The additional bright sources were detected when speckle interferometric techniques were applied (Nisenson and Papaliolios, 1999). The bright source toward the south had a magnitude difference from the primary source of 2.7, while the bright source toward the north had a magnitude difference of 4.2 from the primary source. The original star catalogued by Sanduleak was 6 magnitudes dimmer than the bright source toward the south (Nisenson et al. 1987), from which we can infer that these additional bright sources were additional supernovae.
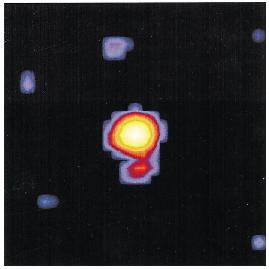
The image below is the result of image processing techniques based on data taken on April 2, 1987 with a 656 nm filter. (Nisenson et al. 1987)
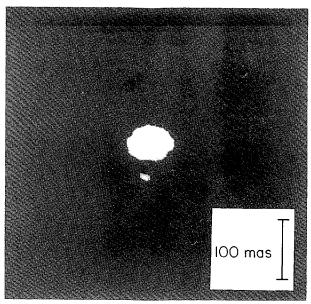
The 2nd bright source toward the north (top) was seen when more advanced techniques were used on the same data taken on April 2, 1987. Nisenson and Papaliolios (1999) explained that the other peaks seen are noise.
There were 3 peaks in the light curve of SN1987a. In the UV band, its apparent magnitude was observed to decrease since Feb 23, 1987 (Blanco et al. 1987) No one knows when light in the UV peaked, meaning that the light from the earliest SN peaked before astronomers began observing SN1987a.
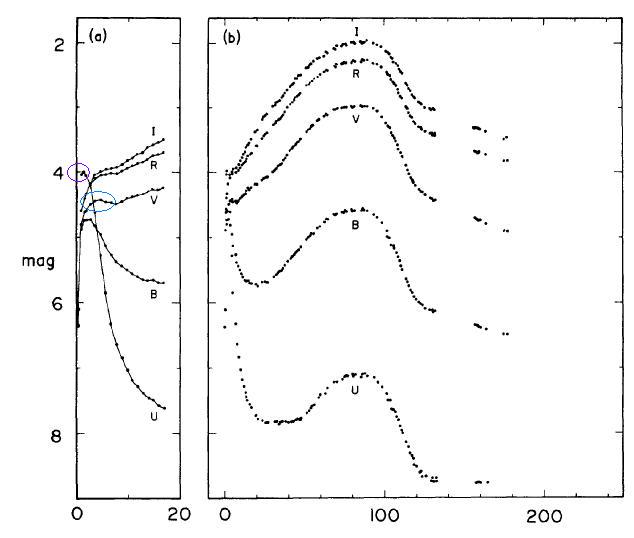
In the V band, its intensity peaked on Feb 28, 1987 and begun a normal decline until March 2, 1987 (Tyson and Boeshaar 1987). This suggests that one of the SN peaked around Feb 28, 1987. After that light at all wavelength was observed to keep increasing until the 90th day, which implies that the last SN peaked at this time.
The graph below from Hamuy et al. (1987) show UBVRI Photometry of SN1987a plotted as a function of time in days since the observed neutrino outburst detected at IMB and Kamiokande. The first 20 days are plotted at an expanded scale. I have highlighted the initial peaks.
There were 3 echoes observed. These echoes can be explained as a single cloud of dust reflecting light from the 3 supernovae. The size of each echo and its rate of expansion would depend on the position of each supernova relative to the cloud. A SN behind the cloud would produce an echo which expands faster than the echo due to an SN in front. The presence of an additional cloud in front of the first cloud would block light from the first cloud. By geometrical arguments, it can be shown that the cloud closer to earth would have a larger radius.
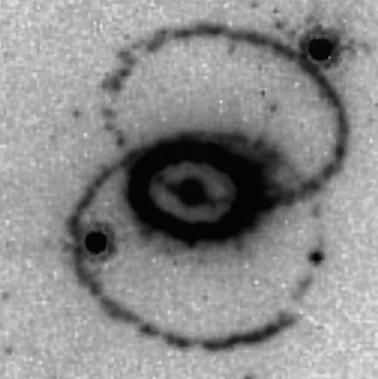
The photograph below is from David Malin (Anglo Australian Observatory-1). He subtracted images taken before (February 1984) and after (December 1990) the supernova appeared. By inspection, we can infer the presence of a smaller secondary cloud toward the south, closer to earth. This second cloud caused the extinction of the first, and produced a larger echo.
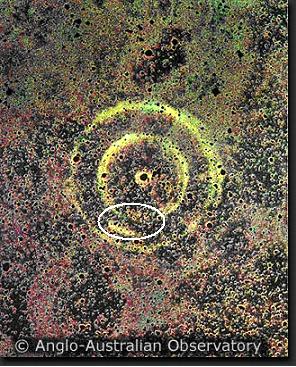
The white oval is highlighted by me to show the presence of the 2nd cloud. We can see the extinction of the medium sized echo here. The supernova responsible for the medium sized echo produced a larger echo in this area.
A ring of ejecta is sometimes formed when a star explodes. Knut Lundmark (1921) wrote,
There is some evidence in favor of the opinion that novae may develop into planetary nebulae.
Click Here to read how a ring is formed when a star explodes.
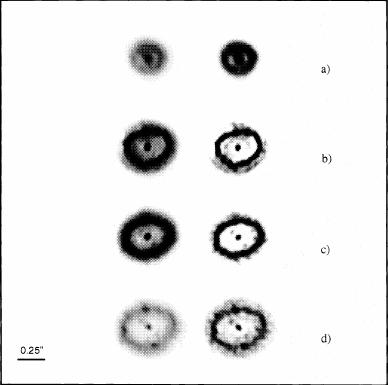
(Paresce et al. 1995) produced a sequence of images showing the ring of Nova Cygni 1992 expanding from May 1993 to May 1994 from the Hubble Space Telescope (HST). The images on the left are the raw images, while the restored images are on the right.
However, SN1987a occurred 3.5 years before the HST was launched. Ground based telescopes could not resolve these rings with clarity, so we do not have a detailed record of this expansion for the first 3 years. Wampler et al. (1990) were able to resolve the rings in 1989 at the La Silla Observatory. The HST image from Sept 24, 1994 (Panagia et al. 1996) is shown below.
Neutrinos are emitted during fusion chain reactions. On February 23.12, (2:52 UT) 1987, the Mont Blanc Underground Neutrino Observatory detected a burst of five pulses about 8 hrs before the first optical observation, followed by a second burst of three pulses about 2 hrs later; Kamioka and Baksan Neutrino Observatories reported observations of a burst made by eleven and five pulses, respectively, delayed by 4.7 hrs in comparison with the Mont Blanc burst (Aglietta et al. 1989).
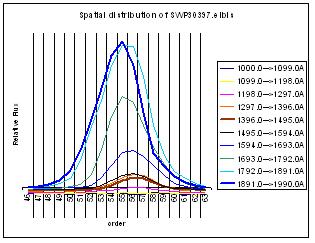
Based on IUE data, we can prove that there were atleast 2 stars which contributed to the initial UV peak. The spatial distribution of light from the IUE in its low resolution mode can be obtained by studying the extended line by line (elbl) file available at the IUE archive (STScI - 1). The elbl file consists of 110 different spectra (called orders), extracted in a direction parallel to the dispersion line. Each order is separated by 1.07 from the adjacent 'order'. The diagram below relates the orders of the elbl file to the orientation of the apertures used in the IUE (Peiro 1985)
The spatial distribution can be studied only along the direction of the major axis of the large aperture. Schiffer (1980) has shown how to calculate the position angle (PA) of the orientation of the large aperture to the celestial north. This angle depends on the position of the target and the sun since the solar panels of the IUE have to be kept normal to the suns rays.
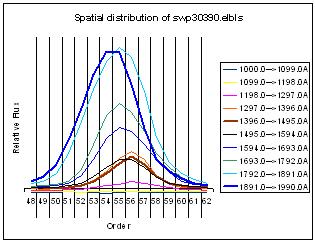
In order to show that the initial UV peak consisted of light from more than one source, I separated the UV light through the short- wavelength- small- aperture (SWSA) on Feb 24, 1987 into 10 separate bands (IUE Data ID SWP30378). In any given band, there could be more than one source contributing. If one of the sources is contributing more light than its neighbors in a particular band, the spatial distribution of that band would be centered closer to the dominant source. The band centered at wavelength 1743Ao had its spatial center at about the 56th order while the band centered at wavelength 1941Ao had its spatial center at about 1.5 orders less.
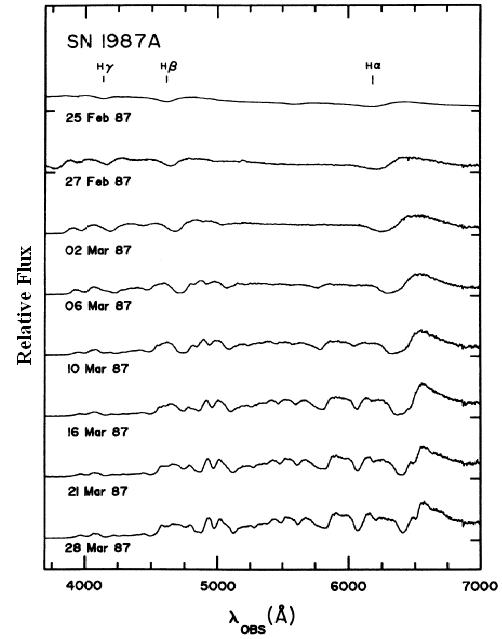
There are features found on spectral scans obtained by Blanco et al. (1987) that can be readily explained if there was more than a single source. There were absorption lines due to Fe and Na which were observed beginning in March 1987 but not observed in February 1987. H lines were seen right from the beginning. The slopes of the H lines were much steeper implying that the deceleration of ejecta from the SN which produced Fe and Na was less.
(I highlighted 2 pairs of absorption features from the spectral scans of Blanco et al. (1987). Note that the green lines have a different slope from the red.)
Phillips et al. (1988) pointed out that the Hα absorption line was square bottomed. This can be explained as the superposition of 2 or more type II SNe with different ejecta velocities.
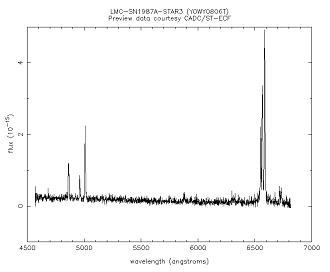
A supernova remnant, may not exhibit absorption lines since fusion reactions starting with elements heavier than Fe are endothermic. This causes the core to be colder than the surface. The spectra of star-3 of the Sanduleak trio, taken on April 3, 1992 by the HST did not exhibit absorption lines (HST dataset Y0WY0806T).
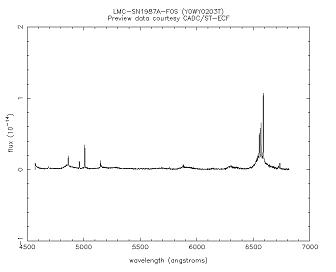
The central star of the Sanduleak trio, which has the reputation of being the only SN, also did not exhibit absorption lines on March 30, 1992 (HST dataset Y0WY0203T).
The spectrum of star 2, which is located toward the north, has Hα emission (Scuderi et al. 1996). It also has several absorption lines.
Nisenson and Papaliolios (1999) saw the object toward the south twice on the 30th and 38th day. Meikle et al. (1987) saw this object on the 50th day but with a larger separation. Others viewed these observations with skepticism. The reconstruction on the 38th day show that light on this day was dominated from the central source. From the UBVRI photometry of SN1987a, we can see that the source which was dominating on the 38th day was the same source which dominated on the overall peak of the 3rd month. Nisenson and Papaliolios (1999) failed to redetect the bright source toward the south on the 98th day. This is expected since the central source was very bright compared to its neighbors on this day.
The position of these bright sources is not in agreement with the position of the two companion stars. Neither are the companion stars centered in the two larger rings of ejecta. The reasons for this could be:
i) The ejecta was attracted toward the common center of gravity. This might explain why the companion stars were not centered in the rings of ejecta.
ii) The superposition of two or more Gaussian curves (or any curve which may approximate the stellar profile of a SN) doesnt preserve the position of the original peaks, unless both the curves are well separated. If both sources are very close, the peak of the superposition would depend on the width, the separation of the sources and their individual peaks) This might explain why Nisenson and Papaliolios (1999) measured a separation 0.06 for the source toward the south, but Meikle et al. (1987) measured a separation of 0.074.
iii) The algorithms used to reconstruct the images did not preserve the position of the additional sources. This could happen if the phase of the Fourier transform of the image is changed.
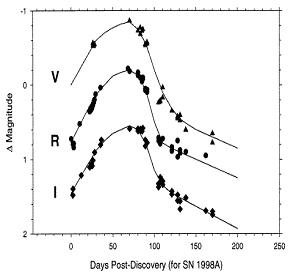
Most supernovae have displayed only a single peak in its light curve (The Astronomer). The increase in luminosity is due to its expanding photosphere, and the decline due to the ejecta becoming more transparent. Light in different bands have all peaked at roughly the same time, for example the light curve of SN1998A below:
SN1993J had 2 peaks (Richmond et al. 1994). Like SN1987a, observations for SN1993J started after its initial peak.
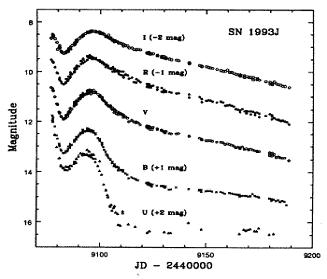
The initial absorption lines of SN1993J were different from that at a later stage (Filippenko et al. 1993). This observation suggests the presence of another source associated with the 2nd peak of SN1993J.
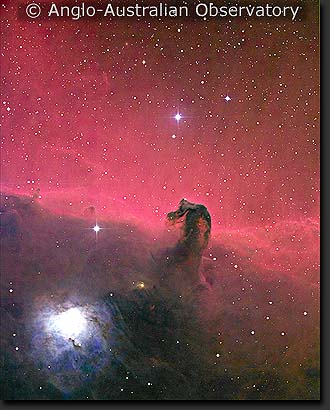
The common explanation given for the light echoes are multiple dust sheets (e.g. Xu et al. 1995). If we are able to see reflected light from a cloud light years away from the source, that would imply that the dust cloud is fairly thick. A cloud which is fairly thick would cause the extinction of clouds behind it. This would give rise to a dark cloud similar to the horsehead nebula (AAO-3).
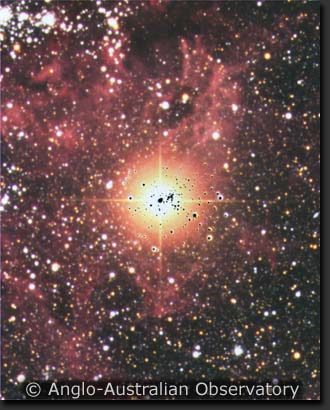
The nebulousities around SN1987a are dimmer toward the south and west. The red emission seen in the nebulousities surrounding SN1987a is Hα emission (Tyson and Boeshaar, 1987). In the photo below (by David Malin, AAO-2), top left is NE. Note that the nebulousities toward the north and east are stronger than toward the south and west.
The light echo images show that the rings are brighter toward the north. Toward the south and west, there is extinction due to the presence of another cloud closer to us; which can be inferred by partial larger echoes. If there were 2 dust sheets which caused the 2 large complete echo circles, why should both of them be denser toward the north?
Below is a series of 6 echo only images, taken at different epochs (David Malin, AAO). These images were made by photographically subtracting one image from another, usually by aligning a positive copy of a pre-SN plate on an original post-SN plate (Couch et al. 1990). Bottom left is NE. Note that the echoes are stronger toward the north for both the large complete rings.
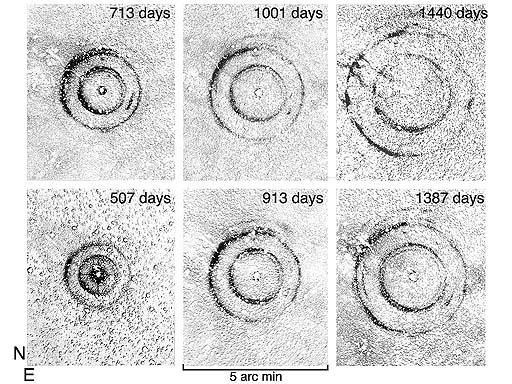
This section proves that most likely: The largest echo ring is caused by the bright source Star 2. The medium sized ring is caused by Star 3. The smallest ring is caused by the famous central star.
i) The position of the centers of the large echo rings.
David Malin, who photographed the light echoes from the AAO, has given me 12 high resolution images of the echoes and explained them. Some of these images are available from Spyromilio et al. (1995). I have attempted to determine the exact centers of both the large echoes. A circle fits these echoes very well. The algorithm I used to determine the exact center is by finding the circle along which the integrated flux has the maximum average intensity.
In all these images, the center of the largest echo was situated north of the center of the medium sized echo. The separation of both these centers along the N-S direction was 3.9±1.7 (1 standard deviation). The spatial separation along the E-W direction was more scattered, with the standard deviation being more than the actual separation of stars 2 and 3. The central SN and Star 3 are separated by a declination of 0.4. The central SN is separated from Star 2 by a declination of 2.0.
This is a modified image from David Malin taken on 21 Nov, 1989. NE is top left. Both centers and circles are shown. The center of the larger echo (in green) is situated north of the center of the smaller echo (in red). The radii of the circles are 117 and 69.

Based on the separation of the echo centers along the N-S direction, we can assert that the most probable sources of the large complete echoes are stars 2 and 3. The smallest echo is very small and not visible in some images; hence impractical to try determining its exact center.
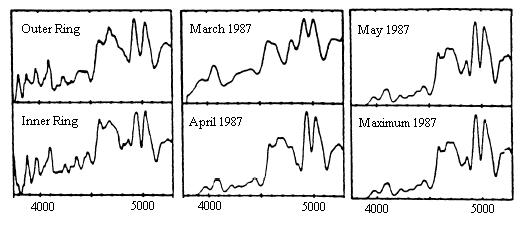
ii) The spectra of the large echo rings.
Stars 2 and 3 of the Sanduleak trio were very blue. The 3rd peak in the light curve which was observed on the 90th day was a very red peak, and the blue component was negligible. The spectrum of the SN was completely dark below 380nm from about March 6 (Hearnshaw et al. 1988). However, the blue component of both the large echoes was not negligible.
At sunset, our sky is red. Clouds are grey. Most often our sky is blue. All these objects reflect sunlight, yet none of them is the same color as the sun. Light scattering involves many complications; so we cannot expect perfect reflection. We can make a rough comparison to decide whether the echo was due to reflected light of the first 10 days (when light from SN1987a was being dominated by the neighbors) or reflected light from the 3rd month when the central source dominated. Suntzeff et al. (1988) measured the color of the largest echo as (B-V) = 1.16 and (V-R) = 0.35. The average color of SN1987a during its peak was (B-V) = 1.65 and (V-R) = 0.72. The (V-R) color of the largest echo was the same as SN1987a in February 1987 and the (B-V) color was the same as SN1987a in early March (comparison with Menzies et al. 1987).
The spectra of the two large echo rings compared against the averaged spectra from the months of March, April, May, and the average during the 71 days of peak luminosity (Terndrup et al. 1988) is shown below:
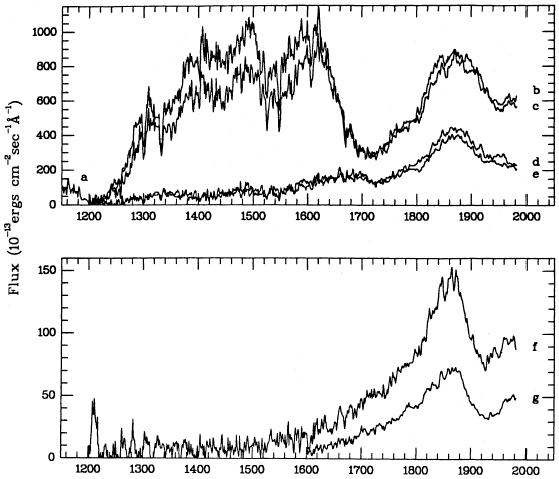
UV light in the range of 1300Ao - 1600Ao was observed to decrease much more rapidly than in 1800Ao - 1900Ao during the first week. On Feb 24, flux from the band centered at 1446Ao was comparable to the band centered at 1941Ao and centered at a higher order (IUE Data ID SWP30378). At this epoch, the orientation of the SWP small aperture was such that a higher order was south of a lower order.
These short UV spectra below are taken from Kirshner et al. (1987). Scans b and c were taken on Feb 24, d and e were taken on Feb 25, f and g were taken on Feb 26. Note that light with wavelength below 1700Ao declined much more rapidly than that above 1800Ao
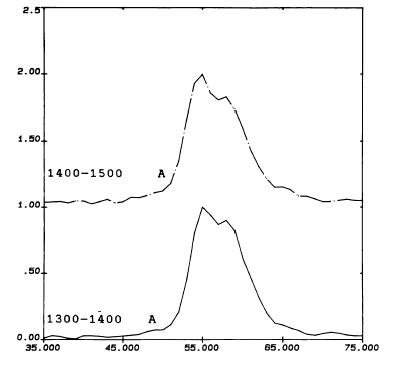
Data taken on Feb 25 (SWP30390) and Feb 26 (SWP30397) confirm that the source which dominated the band centered at 1446Ao was situated south of the source which dominated the band centered at 1941Ao. We can also observe that the spatial distribution for each intermediate band gradually moves south with decreasing wavelength. This is expected if the object toward the south was hotter.
Compare the relative flux of the bands highlighted in bold on Feb 26 (SWP30397) with data of the previous 2 days.
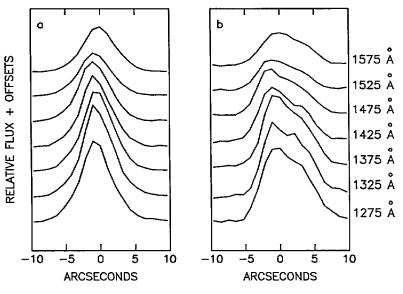
Sonneborn et al. (1987) showed that UV light after March 1987 was due to stars 2 and 3 by comparing the spatial distribution of short UV light from a single point source (a) to that of SN1987a on March 13, 1987 (b).
The usual practice in SN identification is the presence of an abnormally bright star, but in the case of SN1987a, the absence of UV light from the central star after March 1987 was interpreted as it being the source of the initial UV outburst??
The spatial distribution of SWP data on March 3, 1987 at two different bands is similar. The stronger peak is north of the 2nd peak. (Panagia et al. 1987).
Instead of deviating from tradition, they could have interpreted stars 2 and 3 being plateau type SNe. (For SN1993J, UV light had reached plateau stage while visible light declined.)
To summarize, the most likely scenario: Star 3, which was at the south, was the dominant source for UV light shorter than 1600Ao for the first few days. We observed it declining rapidly. Stars 2 and 3 contributed to UV light longer than 1800o. From the light curve of SN1987a, if we conclude that the 2nd peak on February 28, 1987 was due to Star 2, then we must also conclude that it was increasing in luminosity before this. The decline of UV light longer than 1800Ao from Star 3 was much more than the increase due to Star 2, hence UV light longer than 1800Ao was observed to decline less rapidly.
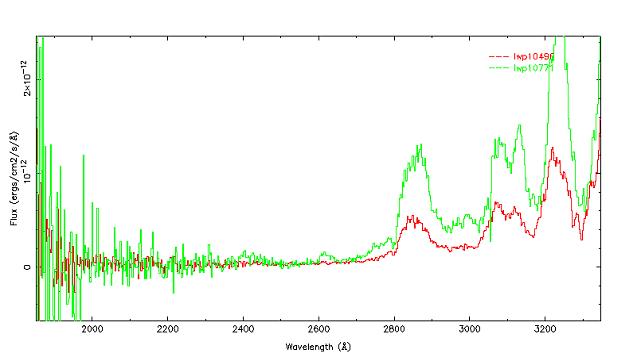
Kirshner et al. (1987) have shown that UV light had stabilized by early March. This implies that one of the SNe had reached a plateau stage, where the expanding photosphere cools down becoming transparent. The 3rd SN peaked at around May 1987. We can see the effect of this famous SN by comparing IUE data taken on April 5, 1987 (LWP10496) and May 15, 1987 (LWP10771). Being very red, only long UV light was observed to increase. At short UV light, the neighbors continued to dominate.
If one of the SNe had an element in abundance, but not in its neighbors, then the P-Cygni profile of that element would manifest itself strongly when its SN peaks and diminish when a neighbor peaks. Tyson and Boeshaar (1987) identified an absorption feature at 5500Ao (which they attributed to He I) which was present initially but disappeared at the 2nd peak on Feb 28, 1987. They also observed that an absorption feature at 8200Ao (Ca II) which was not present initially, showed up during the 2nd peak.
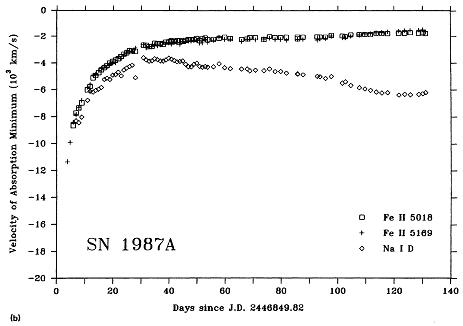
After the 2nd peak faded, Fe and Na lines appeared. The measured velocity for the absorption minima Fe II lines were quite normal, decreasing gradually. Fe was probably abundant only in the 3rd SN. By July 1987, based on the absorption minima of Fe lines, the ejecta from the central star had decreased below 1800 km/s.
The measured velocity of the Na ID absorption minima decreased initially, and after the 40th day began to increase (Phillips et al. 1987). The Na ID absorption minimum was square bottomed on March 22, 1987. These observations indicate that there were 2 blended absorption features, and the increase of measured velocity was due to the 2nd feature becoming more prominent.
For the light echo to be observed, the reflecting cloud must have been dense.
Comparing the nebulousities and the echoes, we can conclude that the HII cloud was responsible for the reflection,
since the light echoes are most visible where the Hα emission is strongest. Couch et al. (1990) wrote, The arcs are most visible in the region of brightest nebulosity.
We would expect molecular absorption to be present in the spectra of sn1987a if a dense cloud was in between earth and the SN. We have not detected any molecular absorption toward sn1987a (Vidal-Madjar et al. 1987).
However, in diffused interstellar medium, we would expect ionic and atomic absorption. Star 2, Star 3 and the central SN exhibit this absorption at 280 km/s (DOdorico et al. 1991). Hα emission from 100" north of sn1987a has roughly this same velocity (Xu and Crotts 1999). Since there is atomic interstellar absorption at this velocity, but no molecular absorption, we can conclude that sn1987a and its neighbors are located within the diffused LMC, but in front of the dense molecular HII cloud.
Another reason why we can conclude that a dense cloud is not in front of the supernova is because we can see the SN clearly. A dense cloud will most probably block light from the SN, unless it is doughnut shaped.
If the dense cloud is 1 light year behind the SN, we would be able to see the echo only 2 years after the SN explosion, since that would be the additional time taken for light to travel to the cloud and be reflected back. If the cloud is equidistant as the SN, the additional distance traveled by the echo would be Dθ, where D is the distance of the SN or cloud from the earth, and θ is the angular radius of the observed echo after time T.
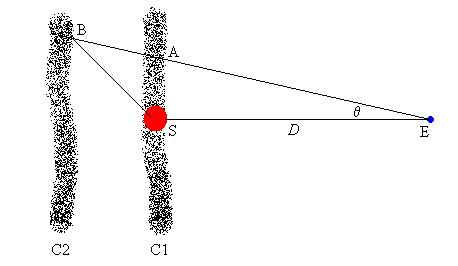
S is a SN situated at distance D from earth E. θ is a very small angle of the observed echo. Hypothetical clouds C1 and C2 are equidistant and behind the SN respectively.
As shown in Fig 21, after time T, assume the echo has an angular radius θ. This implies that the additional distance traveled by the echo is either SB + BA or SA, depending on whether the cloud is behind the SN, or equidistant. After time T, the additional distance traveled by the echo is cT, where c is the speed of light. Since we do not know how far behind the cloud is, lets make the assumption that the reflecting cloud is equidistant as the SN.
The largest echo ring had a radius of 51 on March 8, 1988 (Crotts 1988). The largest echo was most probably caused by Star 2. The 2nd peak on Feb 28, 1987 was most probably caused by star 2. It is reasonable to assume that the echo is due to light reflected from the SN when it peaked, thus the time difference T is 374 days. The distance of the SN from earth can be calculated as cT/θ, which turns out to be 4144 light years.