Noah's flood and the 7 year famine recorded in the book of Genesis can be dated by several methods: By counting the years from ancient genealogies, dendrochronology, ice cores and radiocarbon dating. Uncalibrated radiocarbon dates from the 7 year famine is 4100 years before present (bp). The cataclysmic event that wiped out many ancient civilizations has been dated to 11400 years ago. Even though radiocarbon dates don't match biblical chronology, much simpler methods based on dendrochronology and ice core data match biblical chronology more closely. The uncalibrated radiocarbon dates don't match because the amount of atmospheric radiocarbon has not been a constant. The calibrated dates don't match because tree rings consist of newer carbon being deposited in old rings.
Dr. Willard Libby was awarded the Nobel Prize in Chemistry in 1960 for discovering Radiocarbon Dating, a method to determine the age of historical objects. During the Nobel Lecture, he explained that neutrons which are produced in the upper atmosphere react with the abundant nitrogen-14 isotope to form carbon-14. Carbon-14, being an unstable isotope, decays back to nitrogen-14 with a half life period of 5700 years.
Cosmic rays produce 2 neutrons per second per cm2 of the earth's surface. These two neutrons produce two 14C atoms/second/cm2. These 14C atoms get diluted by a mixing reservoir consisting of 12C and 13C atoms.
Dr. Libby illustrated this as follows: (Q is the production rate of
14C and B is the total amount of carbon in the mixing reservoir)
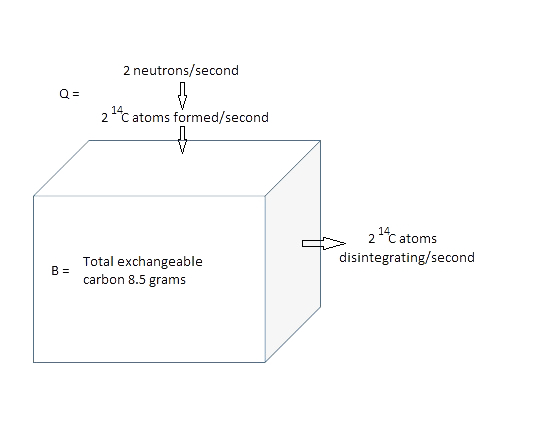
As long as we are alive, the carbon from the food we eat is part of this mixing reservoir. The 14C atoms atoms in living matter are replenished at the same rate as radiocarbon atoms decay. However, when we die, intake of 14C abruptly stops. There is only decay of 14C atoms back to 14N. If at the time of death, the 14C radioactivity is 14 disintegrations /minute/gram, after a half life period of 14C has elapsed, its radioactivity would have reduced to 7 disintegrations /minute/gram according to the law of radioactive decay.
Dr. Libby said, ... assuming that the cosmic rays have been bombarding the atmosphere for a very long time in terms of the lifetime of carbon-14 (carbon-14 has a half-life of about 5,600 years) - we can see that a steady-state condition should have been established, in which the rate of formation of carbon-14 would be equal to the rate at which it disappears to reform nitrogen-14.
Based on biblical chronology, the creation happened few thousand years ago. Trees were created on the 3rd day, while the stars and sun were created on the 4th day. This implies that cosmic rays could have begun bombarding the atmosphere only on the 4th day.
If we assume a constant production rate and a decay proportional to the amount of 14C in the mixing reservoir, the differential equation describing the variation of C14(t) over the years is
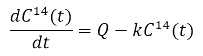
The solution of this differential equation assuming that there was no 14C to begin with is
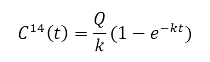
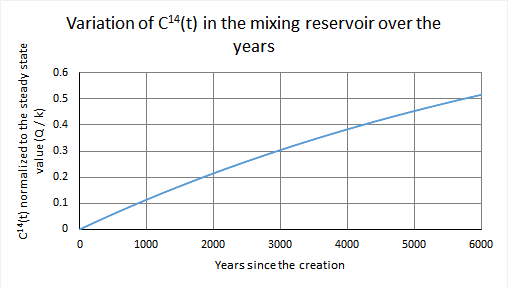
An attempt to predict the variation of radiocarbon in the mixing reservoir assuming biblical chronology is correct, a constant production rate and a constant reservoir would yield a graph that looks something like this.
The value of 14C relative to the total amount of carbon in the exchangeable reservoir measured today has increased due to atomic bombs and has decreased because of the industrial revolution. Petroleum and coal combustion release CO2 to the atmosphere that is depleted in 14C. Atom bombs produce artificial neutrons.
Since we do not know the initial concentration of 14C in a sample, calibration is needed. The age of tree rings can be directly counted. By measuring the activity 14C today in a tree ring that was formed 2000 years ago, researchers calculate the amount of 14C that was present 2000 years ago.
(The practice today among radiocarbon labs is to report a date in terms of years before present, and then calibrate it to true calender years using tree ring data. The number of years before present is the number of years before 1950AD if the amount of radiocarbon in the mixing reservoir has remained a constant.)
Tree rings can only be used for calibration if old rings are dead, that is there is no additional carbon being deposited in old rings. Sapwood, which is usually lighter colored, consists of the newer rings which transport sap. These rings are porous compared to the rings in the heartwood. The image below is taken from northernwoodlands.org
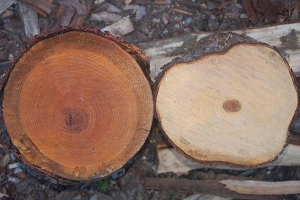
The vessels in heartwood are filled with organic material which prevent the flow of fluids. The transition from sapwood to heartwood happens many years after the ring is formed. If the ring was formed 3000 years ago, and transitioned to heartwood 2500 years ago, then carbon was deposited there between 3000 to 2500 years ago.
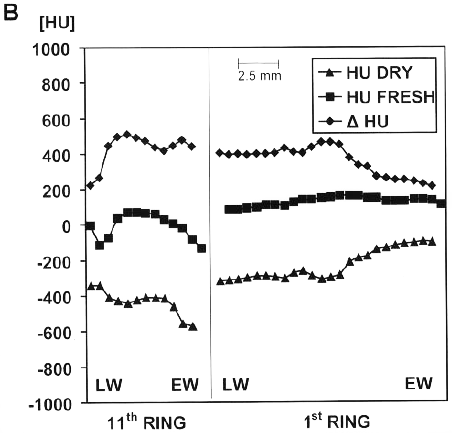
Fromm et. al. (2001) measured the dry density of heartwood and sapwood through CT scan, and found that heartwood is more dense. They micrographed a cross-section of oak and wrote, We checked the occurrence of tyloses in the fresh scanned disc of oak and found all vessels of the seven outer rings open. Tyloses only appear in the water-reduced heartwood.
The following density measurement of the 1st (heartwood) and 11th ring (sapwood) is from their paper. The 'HU' (Hounsfield units) at the y axis correlates with density. The dry density of heartwood is more than sapwood.
Dr. Libby claimed that historical artifacts of known age yielded the expected number of radiocarbon years. His calculations assumed a constant 'mixing reservoir'. He wrote, ... the 2 atoms per second per cm2 go into a mixing
reservoir with about 8.5 grams of carbon per cm2, this gives an expected
specific activity of living matter of 2.0/8.5 disintegrations per second per
gram of carbon
The carbon in living beings come from the food we eat. Plants convert atmospheric CO2 to food. If the oceans, which contain older dissolved carbonaceous material release CO2 to the atmosphere, the initial 14C concentration in a sample would be less than otherwise.
In the polar regions, snowfall accumulates year after year without melting. Researchers have extracted this ice and measured the amount of CO2 trapped in air bubbles.
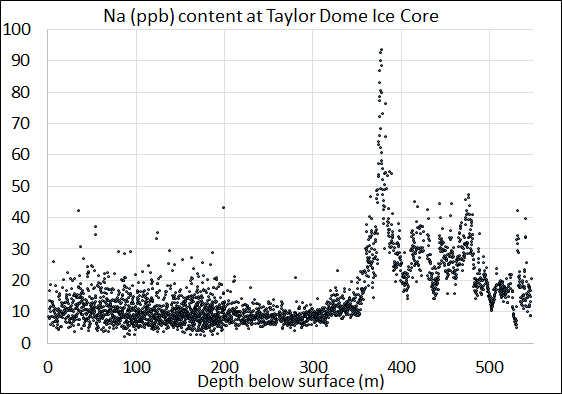
Salt in an ice sheet could be used to mark the flood. The Taylor dome ice core from Antarctica is 554m deep. At 360m, there is an increase of NaCl content (Mayewski et. al. 1996), indicating that the ice above this level is from snowfall after the flood.
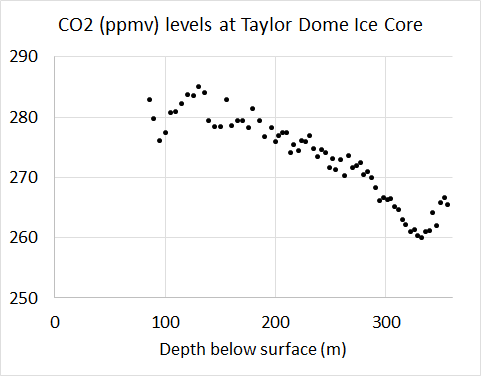
The CO2 level (Indermuhle et. al. 1996) has increased by about 8% since the flood (by comparing the ice at the surface to that at 360m). CO2 can diffuse through ice (Ahn et. al. 2008), so this 8% is a smaller value than the true historical gradient. This new CO2 being introduced to the atmosphere would likely be deficient in 14C compared to the CO2 already present. Since the industrial revolution, burning of coal and petroleum would also release CO2 that is deficient in 14C.
The average annual snowfall at the Taylor Dome Ice core is 67mm water equivalent (Scarchilli et. al. 2011). The depth to the layer containing NaCl is 360m. We can estimate when the flood happened by assuming that historical levels of snowfall were the same as the past few decades. The density of ice compressed from snow is ~ 0.9 that of water. The estimated number of years is about 4800 years (360*0.9/0.067), which is not very far from the 4200 years obtained from biblical chronology.
An example of a pre-flood civilization is the occupation at Koonalda Cave, 60 metres below the Nullarbor plain of Australia. The Nullarbor plain consists of limestone, and since limestone is formed from marine animals, it is reasonable to conclude that the Koonalda Cave was buried and the Nullarbor plain formed during the flood. Radiocarbon dates from the Koonalda Cave are in the range of 16-27 thousand years before present (Gillespie 2002).
An example of a post-flood civilization is Egypt. The pyramids are built on top of the limestone plateau of Giza. The position of the structures built by a particular civilization relative to a local limestone layer can be used to determine whether that civilization existed before or after the flood. Radiocarbon dates from the pyramids are mostly less than 5000 years before present (Bonani et. al. 2001)
Dr. Libby attributed this cataclysm
to an ice sheet, saying, Perhaps the most interesting single general result in this
prehistoric period is the time at which the last ice sheet moved down to
cover the northern part of the United States and the European continent. The
result 11,400 years ± 200 years has now been well established by the radiocarbon
technique; i.e. the radiocarbon dates for this cataclysmic development
show first that it happened simultaneously in Europe and in North
America and that the phenomenon was very widespread, and that it had a
tremendous impact on the living habits of the people the world over; e.g.,
the oldest sign of man in Northern Europe and in England is younger than
this, presumably because of the thoroughness with which the glacier removes
all sorts of human artifacts.
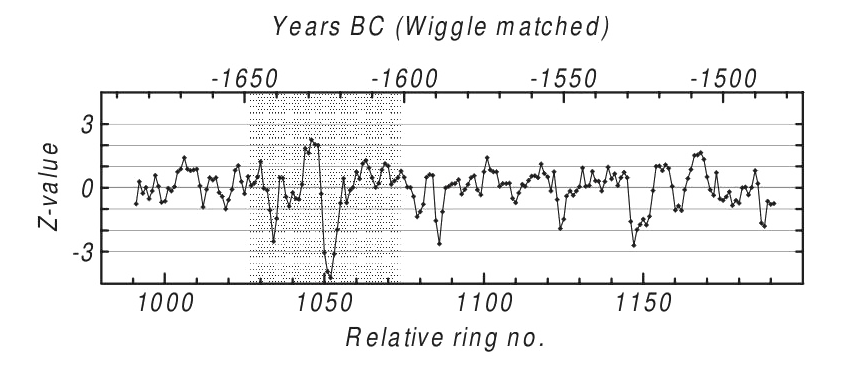
According to biblical chronology, the 7 year famine happened in the 2236th year when Joseph ruled over Egypt. The famine stela records that the 7 year famine happened during the reign of Djoser (Lichtheim). According to dendrochronology, there was a consecutive 7 year period in 1628BC when the annual ring width was less than average. For 4 consecutive years during this period it was less than 3 standard deviations. The image below is taken from Grudd et. al. 2000
From straw at the pyramid of Djoser, we can calculate how much of atmospheric 14C was present during the famine. The average of 3 samples of straw is 4104 years bp. The data (Bonani et. al. 2001) is shown below:
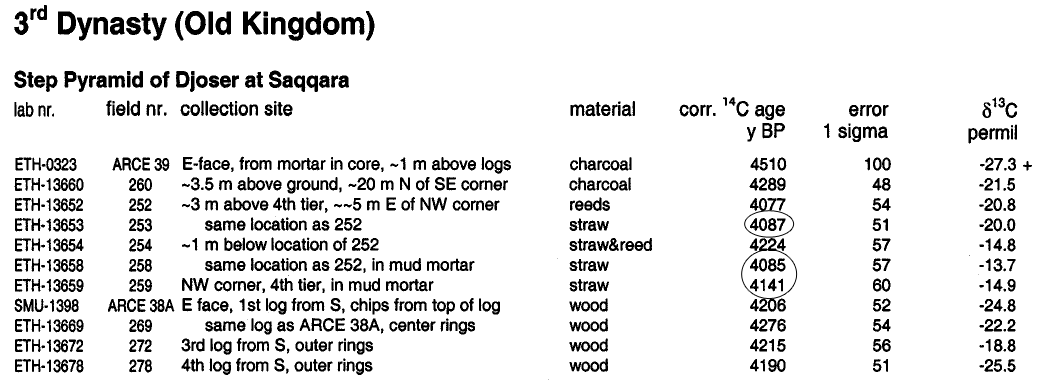
The reason for choosing straw rather than reeds, charcoal or wood from Bonani's data is because wood contains old carbon, that does not reflect its current atmospheric 14C. Wheat ripens within 1 year, so straw reflects its atmospheric carbon more accurately. Reeds growing by the Nile may derive its carbon from limestone plateaus as the river cuts through, which again is old.
An event that happened in 1628BC should should give a date of 3578 years bp. Since radiocarbon dating gives a result 526 years earlier, it implies that the amount of atmospheric 14C at 1628BC was 0.94 the reference value used by radiocarbon labs to denote 1950AD.
Radiocarbon dating doesn't match biblical chronology because we do not have an accurate way to calibrate from years 'before present' to true calender years. Simpler methods such as dating an ice core using observations made today and dendrochronology match biblical chronology more closely.
© Selva Harris
2016